Case study · FINA 695
Walk-Forward Alpha
ML models for cross-sectional stock-return prediction
The question
Which model family — linear, tree-based or neural — best predicts the cross-section of stock returns, judged by the long-short portfolio it builds?
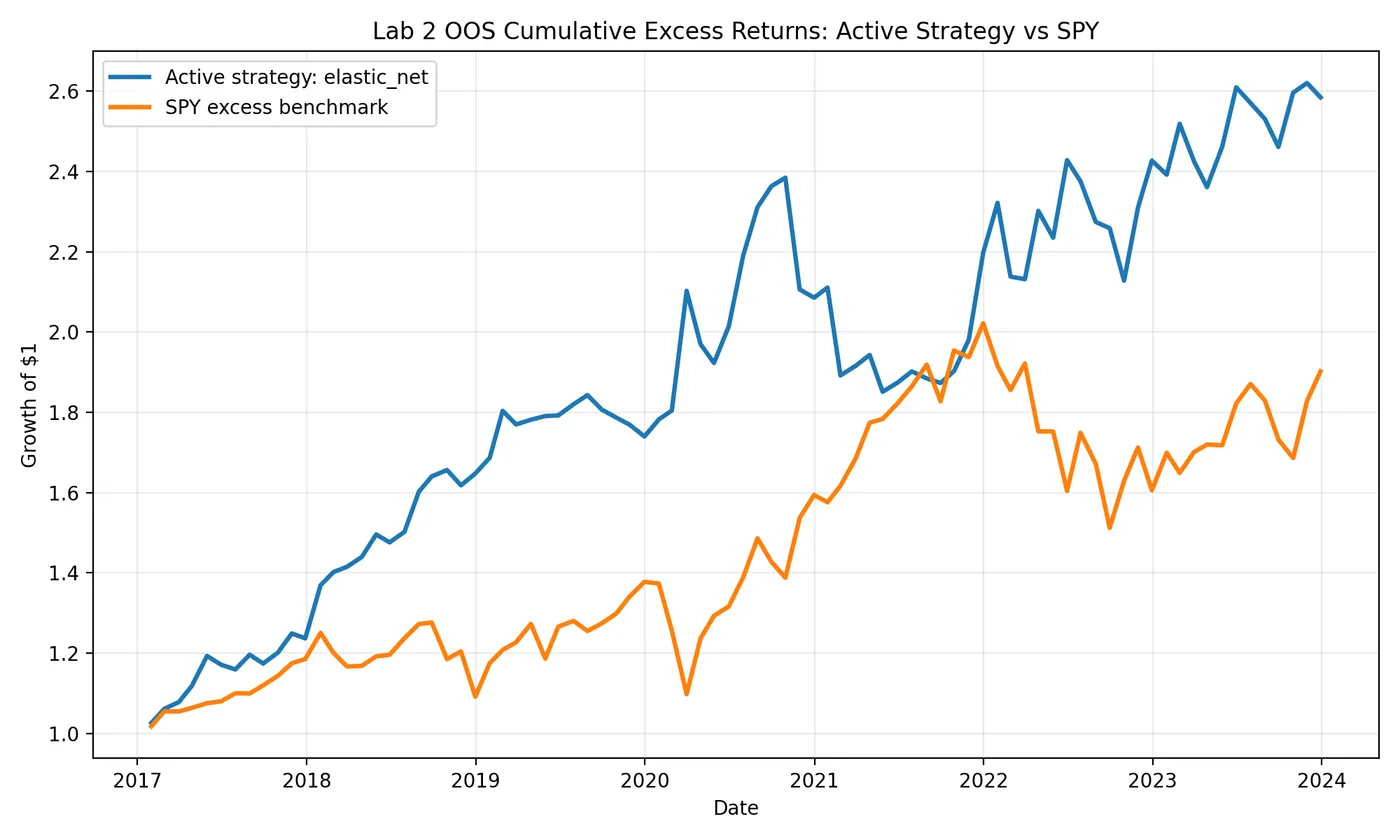
Linear, tree-based and neural models compared walk-forward over 84 out-of-sample months (2017–2023), each driving a monthly long-short portfolio. Elastic Net delivered a 14.83% annualized long-short return and 17.41% alpha relative to SPY excess returns.
How it works
- 01
147 firm characteristics, median-imputed and rank-scaled across stocks every month.
- 02
Six model families: Lasso, Ridge, Elastic Net, Random Forest, gradient-boosted trees and a two-hidden-layer neural network.
- 03
Walk-forward: each test year trains on an expanding window, validates on the two years before it, then tests on the untouched year — 84 out-of-sample months, January 2017 to December 2023.
- 04
Predictions drive monthly value-weighted long-short portfolios with at least 50 names per side.
- 05
Scored against a zero-return OOS R² benchmark and SPY excess returns; the repo's tests recompute the headline metrics from the saved monthly series.
Results
0.948
Elastic Net Sharpe — vs 0.633 for SPY excess
14.83%
annualized long-short return
17.41%
annualized alpha vs SPY excess returns
−22.37%
max drawdown — vs −25.22% for SPY excess
0.733%
best OOS R² (Lasso), 42,342 predictions
From the repo
Known limits
- —Elastic Net is highlighted after the fact for having the best Sharpe — a descriptive choice with selection bias, not a second untouched test.
- —Historical academic data: no live trading, market impact or borrow constraints.
- —Alpha is the intercept of a single-factor regression on SPY excess returns — not a causal estimate.